Soil nutrient UV-visible spectrophotometric analysis is a sensitive, cost-effective, and widely standardized technique for quantifying nitrogen, phosphorus, organic matter, and micronutrients in soil extracts. By measuring the characteristic absorbance of chromogenic complexes or UV-active ions, the method delivers reliable data for soil fertility evaluation, precision fertilization, and environmental monitoring in accordance with ISO, ASTM, and GB/NY reference standards. This article explains the technical principles, sample types, testing items, analytical methods, and practical applications of UV-Vis spectrophotometry in soil nutrient analysis.
Technical Overview
UV-visible (UV-Vis) spectrophotometric analysis quantifies soil nutrients by measuring the absorption of ultraviolet or visible light, typically in the 190 to 900 nm range, by specific chemical species present in a soil extract. According to the Beer-Lambert law, the absorbance measured at a characteristic wavelength is directly proportional to the concentration of the target analyte, enabling accurate quantitative determination after the analyte is converted into a colored complex by selective chromogenic reagents or measured directly when it absorbs in the UV region, as in the case of nitrate.
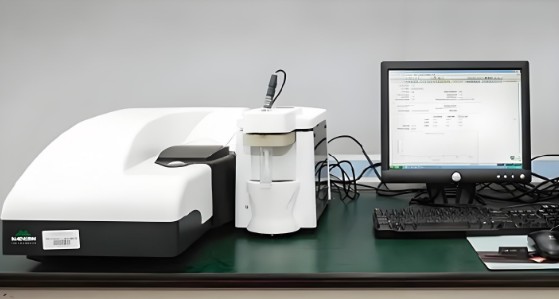
A modern UV-Vis spectrophotometer consists of a broadband light source, combining a deuterium lamp for the ultraviolet region and a tungsten-halogen lamp for the visible region, a monochromator for precise wavelength selection, a sample compartment holding matched quartz or glass cuvettes, and a photodetector connected to data-processing software. Instruments supporting wavelength scanning, dual-wavelength correction, and automated baseline compensation are particularly valuable for soil analysis because soil extracts frequently contain dissolved organic matter and colloidal particles that cause matrix interference.
- Nitrate nitrogen: direct UV absorbance at 220 nm with interference correction at 275 nm
- Ammonium nitrogen: indophenol blue complex measured at 625 nm, or Nessler reagent at 420 nm
- Available phosphorus: molybdenum blue complex measured at 700 to 880 nm
- Organic matter and organic carbon: dichromate oxidation colorimetry at approximately 590 nm
- Micronutrients (Fe, Mn, Cu, Zn, B): selective chromogenic complexes measured between 420 and 540 nm
Testing Samples
Agricultural and Cultivated Soils
Plow-layer samples collected from 0 to 30 cm depth in cropland represent the most common matrix. These samples are analyzed for mineral nitrogen, available phosphorus, organic matter, and micronutrients to support soil fertility grading and seasonal fertilizer recommendations.
Forest, Grassland, and Ecological Monitoring Soils
Undisturbed or minimally disturbed soils from forests, grasslands, nature reserves, and long-term ecological monitoring plots are tested to characterize nutrient status, organic carbon stocks, and nutrient cycling dynamics under natural vegetation.
Greenhouse Soils, Horticultural Substrates, and Growing Media
Intensively managed greenhouse soils and soilless or blended growing media are analyzed frequently because of rapid nutrient depletion or accumulation caused by high-input fertigation regimes. Salinity and nutrient imbalance screening is often combined with routine UV-Vis nutrient panels.
Remediated, Degraded, and Problem Soils
Saline-alkali soils, acidified soils, mining-affected soils, and remediated sites are tested to verify nutrient recovery, assess amendment effectiveness, and confirm that fertility has been restored to levels suitable for the intended land use.
Testing Items
Typical UV-Vis testing panels for soil nutrient evaluation include the following analyte groups, each mapped to a specific extraction scheme and chromogenic reaction:
- Nitrogen fractions: nitrate nitrogen (NO3-N), ammonium nitrogen (NH4-N), alkali-hydrolyzable nitrogen, and total nitrogen after Kjeldahl or persulfate digestion
- Phosphorus fractions: Olsen-available phosphorus for neutral and calcareous soils, Bray-I available phosphorus for acidic soils, and total phosphorus after acid digestion
- Organic matter and organic carbon determined by sulfochromic (potassium dichromate) oxidation colorimetry
- Micronutrients: DTPA-extractable iron, manganese, copper, and zinc, plus hot-water-soluble boron
- Supplementary parameters: sulfate sulfur, soluble silica, and exchangeable aluminum in specific agronomic or environmental investigations
Testing Methods
Sample Preparation and Extraction
Field-moist samples are air-dried at room temperature, gently crushed, and passed through a 2 mm sieve for available nutrient extraction, while a 0.25 mm sieve fraction is prepared for organic matter and total nutrient analysis. Common extraction schemes include 2 mol/L potassium chloride for mineral nitrogen, 0.5 mol/L sodium bicarbonate at pH 8.5 for Olsen phosphorus, 0.03 mol/L ammonium fluoride with dilute hydrochloric acid for Bray-I phosphorus, DTPA-TEA solution buffered at pH 7.3 for micronutrients, and hot water reflux for boron.
Colorimetric and Spectrophotometric Determination
- Nitrate nitrogen: absorbance is read at 220 nm with a correction at 275 nm to subtract organic matter interference, using the corrected absorbance A = A220 minus 2A275 against potassium nitrate calibration standards
- Ammonium nitrogen: the indophenol blue reaction with phenolate and hypochlorite, catalyzed by sodium nitroprusside, is measured at 625 nm
- Available phosphorus: ammonium molybdate-antimony potassium tartrate reagent with ascorbic acid reduction forms molybdenum blue, measured at 700 or 880 nm
- Organic matter: residual hexavalent chromium after dichromate-sulfuric acid oxidation is measured at approximately 590 nm against glucose calibration standards
- Iron, manganese, copper, and zinc: determined as o-phenanthroline, formaldoxime, DDTC, and dithizone complexes, respectively, at their characteristic wavelengths between 440 and 540 nm
- Boron: the azomethine-H complex is measured at 415 to 420 nm
Calibration, Quality Control, and Standards Compliance
Accredited third-party laboratories construct multi-point calibration curves with correlation coefficients of at least 0.999, verify wavelength accuracy using holmium oxide or didymium reference filters, run reagent blanks with every batch, and confirm method performance through certified reference materials, spiked recoveries between 90 and 110 percent, and duplicate determinations with relative deviations below 10 percent. Analyses are performed under ISO/IEC 17025 quality management systems and follow recognized methods such as ISO 14255 for mineral nitrogen, ISO 11263 for Olsen phosphorus, ISO 11261 for total nitrogen by the Kjeldahl method, ISO 14235 for organic carbon by sulfochromic oxidation, and the Chinese agricultural industry standard NY/T 1121 series for routine soil physical and chemical analysis.
Applications
The analytical results generated by UV-Vis soil nutrient analysis support a broad range of agronomic, environmental, and scientific objectives:
- Precision agriculture: generation of nutrient distribution maps for variable-rate nitrogen and phosphorus application, reducing fertilizer waste and environmental losses
- Soil fertility grading and land capability evaluation for crop planning and rotation design
- Protected cultivation management: routine monitoring of greenhouse soils to prevent nutrient accumulation, salinization, and deficiency disorders
- Environmental monitoring: assessment of nutrient loading, runoff risk, and eutrophication contribution from agricultural and rehabilitated land
- Remediation verification: confirmation of nutrient restoration and fertility recovery at degraded or contaminated sites after treatment
- Scientific research: nutrient cycling studies, long-term fertilization field trials, and greenhouse pot experiments
Because the instrumentation is economical, robust, and capable of high sample throughput, UV-Vis spectrophotometry remains the reference workflow for routine soil testing laboratories worldwide, often serving as the confirmatory technique for rapid field test kits.
FAQ
Why is a correction wavelength at 275 nm used for nitrate determination?
Nitrate absorbs strongly at 220 nm, but dissolved organic matter in soil extracts also absorbs at this wavelength. Because organic matter absorbs at 275 nm while nitrate does not, measuring absorbance at both wavelengths and subtracting twice the 275 nm reading from the 220 nm reading corrects the interference and improves accuracy.
What is the difference between the Olsen and Bray phosphorus methods?
The Olsen method uses sodium bicarbonate at pH 8.5 and is intended for neutral, calcareous, or alkaline soils, while the Bray-I method uses ammonium fluoride with dilute hydrochloric acid and is suited to acidic soils. Both methods quantify extracted phosphorus as the molybdenum blue complex by UV-Vis spectrophotometry, but the extraction chemistry is selected according to soil pH and calcium carbonate content.
How are turbidity and color interferences handled?
Laboratories control interference through sample centrifugation or filtration before color development, reagent blanks, sample blanks without chromogenic reagent, dual-wavelength correction, and matched cuvettes. Extracts with extreme color or turbidity may require dilution or an alternative analytical technique.
How should soil samples be stored before analysis?
For mineral nitrogen, samples should be kept cold and analyzed rapidly because microbial activity alters nitrate and ammonium concentrations during storage. For available phosphorus, micronutrients, and organic matter, air-dried samples stored in sealed containers at room temperature remain stable for extended periods.
What detection limits and turnaround times can be expected?
Typical method detection limits are in the range of 0.01 to 0.1 mg/kg for mineral nitrogen species and available phosphorus, and sub-mg/kg levels for most micronutrients, depending on extraction ratio and instrument performance. Routine sample turnaround is generally three to seven working days, as extraction, color development, and measurement can be parallelized across batches.