Oxygen content analysis is a critical quality-control step for photovoltaic silicon wafers, because interstitial oxygen directly affects wafer mechanical strength, thermal donor formation, bulk microdefects, internal gettering efficiency, and light-induced degradation in finished solar cells. This article explains why oxygen control matters in PV-grade crystalline silicon, the sample types and test items involved, and the standard test methods — such as FTIR spectroscopy per ASTM/SEMI MF1188 and GB/T 1558 — used by accredited third-party laboratories to quantify oxygen concentration accurately and reliably.
Technical Overview
Oxygen is the most abundant non-dopant impurity in photovoltaic-grade crystalline silicon. In Czochralski (CZ) growth, which dominates today's mono-crystalline PV wafer market, oxygen enters the melt through dissolution of the quartz crucible and is incorporated into the crystal as interstitial oxygen. Because the effective segregation coefficient of oxygen in silicon is slightly above unity (approximately 1.25), oxygen concentration is typically highest near the seed end of the ingot and decreases along the crystal body, creating characteristic axial and radial distribution profiles that must be mapped and controlled.
Interstitial oxygen concentration in CZ silicon wafers typically falls in the range of 10 to 20 ppma (roughly 5×10¹⁷ to 1×10¹⁸ atoms/cm³, noting that 1 ppma corresponds to about 5×10¹⁶ atoms/cm³). Cast and directional-solidification multicrystalline silicon generally contains less oxygen, typically below about 10 ppma, due to the different crucible-melt interaction and solidification conditions.
Oxygen is neither purely harmful nor purely beneficial; its net effect depends strongly on concentration, distribution, and the downstream cell process thermal budget:
- Thermal donor formation: Oxygen clusters generated during 400–500°C heat treatments act as shallow donors and can shift wafer resistivity outside specification.
- Oxygen precipitation and bulk microdefects (BMDs): During high-temperature cell processing, supersaturated interstitial oxygen precipitates, generating bulk defects that can degrade minority-carrier lifetime if not properly managed.
- Internal gettering: A controlled population of oxygen precipitates can capture metallic impurities away from the active junction region, improving cell performance — a beneficial effect widely exploited in cell process design.
- Boron–oxygen complexes: In p-type boron-doped CZ silicon, boron–oxygen pairs are the root cause of light-induced degradation (LID) in PERC-type cells, making oxygen control essential for yield stability.
- Mechanical integrity: Excessive oxygen-related defects can reduce fracture strength and increase wafer breakage during handling, wire interconnection, and module lamination.
For these reasons, quantitative oxygen content analysis is a routine incoming-inspection and research activity for wafer producers, cell manufacturers, and accredited third-party laboratories supporting the photovoltaic supply chain.
Testing Samples
Monocrystalline CZ Silicon Wafers
Standard 156 mm to 210 mm format pseudo-square or full-square mono wafers, in as-cut, textured, or polished condition, are the most common submission type. Because infrared transmission measurement requires optically smooth surfaces, as-cut or textured wafers are usually accompanied by, or replaced with, double-side polished test coupons taken from adjacent positions of the same ingot or brick.
Multicrystalline and Directional-Solidification Wafers
Cast multicrystalline wafers can be tested for interstitial oxygen, but grain boundaries and structural scattering degrade infrared baseline quality. Analysts apply appropriate baseline correction and often report results with expanded measurement uncertainty, or recommend complementary total-oxygen methods where grain scattering is severe.
Ingot, Brick, and Crystal Cross-Section Coupons
Sliced coupons taken from the seed end, middle, tail end, and edge versus center of ingots or bricks allow full axial and radial oxygen distribution mapping. This sampling strategy is essential for growth-process characterization, hot-zone optimization, and crucible/coating qualification studies.
Thermally Processed Wafers and Coupons
Wafers subjected to simulated or actual cell-process thermal cycles (oxidation, boron or phosphorus diffusion, annealing) are analyzed to quantify oxygen precipitation behavior, precipitated oxygen fraction, and denuded-zone formation, supporting gettering studies and thermal-budget optimization.
Testing Items
Depending on the customer's objective, oxygen analysis of PV silicon wafers typically covers the following measurands:
- Interstitial oxygen concentration [Oi], reported in ppma or atoms/cm³, measured at the 1107 cm⁻¹ infrared absorption band.
- Axial oxygen distribution along the ingot body, and radial (center-to-edge) uniformity across the wafer.
- Substitutional carbon concentration, co-determined at the 605 cm⁻¹ band, since carbon influences oxygen precipitation kinetics.
- Total oxygen content, including precipitated oxygen, determined by inert gas fusion infrared detection or SIMS.
- Oxygen precipitation behavior: residual interstitial oxygen and precipitated oxygen fraction after defined thermal treatments, used to assess internal gettering capability.
- Bulk microdefect (BMD) density and denuded zone depth, characterized as supporting evidence for oxygen-related defect populations.
Testing Methods
Room-Temperature FTIR Spectroscopy (Primary Method)
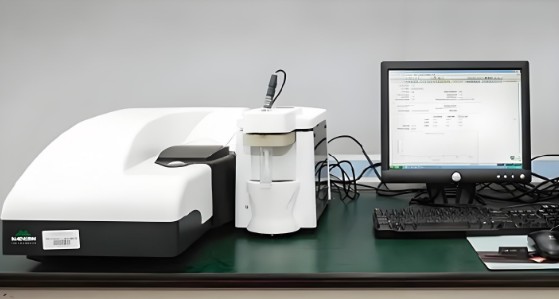
Fourier transform infrared (FTIR) transmission spectroscopy is the industry-standard technique for interstitial oxygen in silicon. The method follows ASTM F1188 / SEMI MF1188, DIN 50438-1, and the Chinese national standard GB/T 1558. A double-side polished specimen, typically 0.5 to 2 mm thick, is measured against a reference spectrum from float-zone silicon, which contains oxygen below the detection limit. Quantification uses the peak absorption at 1107 cm⁻¹ with a calibration coefficient — commonly 4.9 or 9.63 ppma per unit absorption depending on the standard edition — and results are reported in ppma or atoms/cm³. Detection limits on the order of 0.01 to 0.1 ppma are achievable, depending on specimen thickness and surface quality.
Thin-Wafer FTIR Measurement
Current PV wafers are 130 to 180 µm thick, below the ideal range of standard transmission FTIR. For thin specimens down to roughly 50 µm, multi-reflection (multi-pass) FTIR accessories per ASTM F1619 extend the applicable thickness range while maintaining traceability to the same oxygen calibration basis.
Secondary Ion Mass Spectrometry (SIMS)
SIMS provides total oxygen measurement with depth resolution, capturing both interstitial and precipitated oxygen as well as surface and near-surface contamination layers. It is the preferred method for ultra-thin wafers, textured surfaces where FTIR transmission is impractical, and research-grade depth profiling, with detection capability down to the 10¹⁶ atoms/cm³ level.
Inert Gas Fusion Infrared Detection (Total Oxygen)
For total oxygen content independent of lattice site, milligram-scale silicon chips are fused in an inert-gas furnace and evolved oxygen species are quantified by infrared detection, in accordance with ASTM F1724. This method complements FTIR, whose 1107 cm⁻¹ band responds only to interstitial oxygen.
Complementary Defect and Lifetime Characterization
Preferential etching combined with optical microscopy reveals oxygen precipitates and BMD density on wafer cross-sections, while minority-carrier lifetime mapping (µ-PCD or photoluminescence imaging) correlates oxygen-related defect distributions with electrical impact, completing the analytical picture for cell-process development.
Applications
Oxygen content analysis supports every stage of the photovoltaic value chain, from crystal growth to module reliability:
- Crystal growth optimization: evaluating hot-zone design, crucible and coating materials, pulling speed, and argon flow to target the desired axial oxygen profile.
- Wafer incoming inspection and supplier qualification: verifying that purchased wafers meet oxygen and resistivity specifications before high-volume cell processing.
- Cell process engineering: balancing internal gettering benefits against precipitation-induced lifetime degradation, and tuning diffusion and annealing thermal budgets accordingly.
- LID mitigation programs: controlling boron–oxygen complex formation in p-type PERC lines and supporting transitions to gallium-doped or n-type products such as TOPCon and HJT architectures.
- Research and failure analysis: investigating wafer breakage, efficiency loss, and incoming-material disputes with traceable, standards-based data from accredited third-party laboratories.
FAQ
Why is oxygen content so important in PV silicon wafers?
Oxygen governs several failure and performance mechanisms simultaneously: thermal donor generation that shifts resistivity, oxygen precipitation that can either getter harmful metals or degrade lifetime, and boron–oxygen complexes that cause light-induced degradation in p-type cells. Accurate oxygen data allows manufacturers to stay within the process window where the net effect of oxygen is beneficial.
What oxygen levels are typical, and what limits apply?
CZ mono wafers generally contain 10 to 20 ppma interstitial oxygen, with head-to-tail variation across the ingot. Cast multicrystalline material is usually below about 10 ppma. Acceptance limits are set by each wafer or cell maker based on cell architecture and thermal process, and are specified in incoming-inspection agreements rather than in a universal standard.
Can as-cut or textured wafers be measured directly by FTIR?
Direct measurement is unreliable because rough or textured surfaces scatter infrared light and distort the baseline. Standard practice is to prepare double-side polished coupons from the same ingot or brick, or to use SIMS and inert gas fusion methods for total oxygen when polished surfaces cannot be provided.
What is the difference between interstitial oxygen and total oxygen?
Interstitial oxygen refers to oxygen atoms dissolved in the silicon lattice at substitutional-adjacent interstitial sites, detected by the FTIR 1107 cm⁻¹ band. Total oxygen, measured by inert gas fusion or SIMS, additionally includes oxygen locked in precipitates, inclusions, and surface layers. The difference between the two values after thermal treatment is a direct measure of precipitated oxygen.
How should samples be submitted, and what is the typical turnaround?
Recommended submissions include double-side polished coupons (commonly 0.5–2 mm thick for standard FTIR, or thinner sections for multi-pass FTIR), together with wafer identification, dopant type, resistivity, thickness, and the target reporting basis (ppma versus atoms/cm³). Accredited third-party laboratories typically issue FTIR oxygen reports within three to seven working days, including calibration traceability and measurement uncertainty.