EPS polysaccharide standard curve determination is a fundamental analytical procedure for quantifying exopolysaccharides in microbial, food, and environmental samples using colorimetric methods such as the phenol-sulfuric acid assay. This comprehensive technical guide explains the calibration principles, step-by-step protocols, quality control criteria, and practical applications of EPS standard curve construction. Whether you work in fermentation monitoring, dairy science, or wastewater research, this article provides the essential knowledge to achieve accurate and reproducible polysaccharide quantification.
Technical Overview
Exopolysaccharides (EPS) are high-molecular-weight carbohydrate polymers secreted by microorganisms, including bacteria, fungi, and microalgae. Accurate quantification of EPS relies on establishing a reliable standard curve, which serves as the calibration reference for converting colorimetric absorbance readings into polysaccharide concentrations. The standard curve determination is the cornerstone of EPS analysis because it defines the linear relationship between analyte concentration and optical density.
In standard practice, a reference carbohydrate such as glucose, dextran, or a purified EPS preparation is serially diluted to generate a concentration gradient. Each dilution undergoes a derivatization reaction, most commonly the phenol-sulfuric acid method developed by Dubois et al., which produces a chromogenic complex measurable by UV-Vis spectrophotometry at 490 nm. The resulting absorbance values are plotted against known concentrations, and linear regression yields a calibration equation in the form y = ax + b, where the coefficient of determination (R²) should exceed 0.999 for high-quality calibration.
The validity of the standard curve directly affects the accuracy of downstream measurements, including EPS yield calculations in fermentation studies, rheological property evaluations in food systems, and biofilm matrix characterization in environmental microbiology. Therefore, rigorous attention to reagent preparation, pipetting precision, reaction timing, and regression validation is essential.
Testing Samples
Microbial Fermentation Broths
Fermentation liquids from lactic acid bacteria, xanthan-producing Xanthomonas strains, pullulan-producing Aureobasidium, and gellan-producing Sphingomonas cultures represent the most common sample matrices. These broths typically require pretreatment steps such as centrifugation to remove cells, ethanol precipitation to concentrate the polysaccharide fraction, and dialysis to eliminate residual sugars and small molecules that would interfere with the colorimetric reaction.
Dairy and Functional Food Products
Yogurt, fermented milk, whey-based beverages, and exopolysaccharide-enriched functional ingredients contain EPS produced by starter cultures such as Streptococcus thermophilus and Lactobacillus delbrueckii. Sample preparation involves protein removal using trichloroacetic acid (TCA) precipitation or Sevag reagent extraction prior to polysaccharide quantification against the standard curve.
Environmental and Wastewater Samples
Activated sludge flocs, biofilm matrices, and constructed wetland sediments contain bound EPS extracted using heat, cation exchange resins (CER), formaldehyde-NaOH, or ultrasonication methods. These extracts often contain proteins, humic substances, and nucleic acids, requiring careful interference control when comparing absorbance readings against the carbohydrate standard curve.
Microalgal and Cyanobacterial Cultures
Cyanobacteria such as Nostoc, Anabaena, and Arthrospira produce sulfated and anionic exopolysaccharides with complex monosaccharide compositions. Because these polysaccharides may respond differently to the phenol-sulfuric acid reagent than glucose, laboratories often construct the standard curve using purified EPS from the target strain when maximum accuracy is required.
Reference Standards and Pure Polysaccharides
Analytical-grade glucose, galactose, dextran (various molecular weights), and purified EPS powders serve as calibration standards. The choice of standard should reflect the sample composition; glucose is universally accepted for routine work, while purified homologous EPS provides the most accurate calibration for research-grade quantification.
Testing Items
The standard curve determination encompasses the following analytical components:
- Preparation of the primary standard stock solution (typically 1.0 mg/mL glucose or equivalent) with verified concentration
- Serial dilution series spanning the working linear range, commonly 0 to 100 micrograms per milliliter with at least six gradient points
- Colorimetric reaction execution with phenol-sulfuric acid, anthrone-sulfuric acid, or sulfuric acid-resorcinol reagents
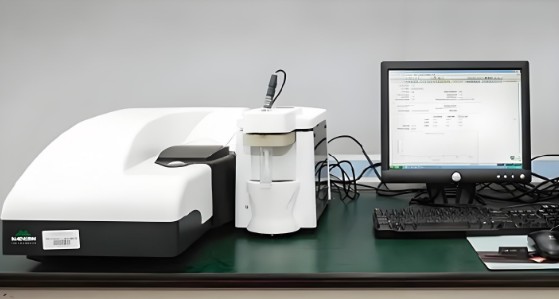
- Absorbance measurement at the method-specific wavelength (490 nm for phenol-sulfuric acid, 620 nm for anthrone method)
- Blank correction using reagent blanks containing distilled water in place of standard solution
- Linear regression analysis generating the calibration equation, slope, intercept, and R² value
- Linearity verification confirming that R² is not less than 0.999 (or 0.99 for routine applications)
- Precision assessment through replicate measurements with relative standard deviation (RSD) typically below 3 percent
- Recovery testing with spiked samples to confirm matrix suitability, targeting 95 to 105 percent recovery
- Stability evaluation of both the standard solutions and the chromogenic products over defined time windows
Testing Methods
Phenol-Sulfuric Acid Method (Dubois Method)
The phenol-sulfuric acid method is the internationally recognized reference procedure for total carbohydrate and EPS quantification. Concentrated sulfuric acid rapidly dehydrates the polysaccharide, generating furfural derivatives that condense with phenol to form an orange-yellow complex with maximum absorbance at 490 nm. The reaction is highly sensitive, detecting microgram-level quantities, but requires careful handling of corrosive reagents and consistent timing because color development continues for approximately 30 minutes before stabilization.
The typical protocol proceeds as follows: aliquot 1.0 mL of each standard dilution into clean test tubes, add 1.0 mL of 5 percent (w/v) phenol solution, rapidly inject 5.0 mL of concentrated sulfuric acid directed at the liquid surface to ensure thorough mixing and heat generation, allow tubes to stand at room temperature for 10 minutes, vortex briefly, then incubate at 30 degrees Celsius for 20 minutes before measuring absorbance at 490 nm against the reagent blank.
Anthrone-Sulfuric Acid Method
The anthrone method employs freshly prepared anthrone reagent dissolved in concentrated sulfuric acid. Heating in a boiling water bath for 10 to 15 minutes converts carbohydrates into furfural products that react with anthrone to yield a blue-green complex measured at 620 nm. This method offers excellent sensitivity for hexose-containing polysaccharides and benefits from a well-defined heating step that improves reaction reproducibility compared with the heat-of-mixing dependency of the phenol method.
Step-by-Step Standard Curve Construction
The recommended workflow for constructing the calibration curve includes:
- Dry the reference standard (glucose or purified EPS) to constant weight in a desiccator, then accurately weigh 100 mg and dissolve in 100 mL of distilled water to prepare a 1.0 mg/mL stock solution
- Prepare working dilutions at concentrations such as 0, 10, 20, 40, 60, 80, and 100 micrograms per milliliter using volumetric glassware or calibrated pipettes
- Pipette duplicate or triplicate 1.0 mL aliquots of each dilution into labeled borosilicate test tubes
- Execute the selected colorimetric reaction with strict timing control applied identically to every tube, including the reagent blank
- Measure absorbance using a pre-warmed spectrophotometer with 1 cm pathlength cuvettes, zeroing against the blank
- Plot mean absorbance values on the y-axis against corresponding concentrations on the x-axis
- Perform least-squares linear regression to obtain the equation, slope, intercept, and R² value
- Verify that residuals are randomly distributed and that no systematic curvature indicates range saturation
- Store the validated curve parameters and prepare new calibration with each analytical batch or at defined intervals
Data Processing and Quality Control
Concentrations of unknown samples are calculated by substituting corrected absorbance values into the regression equation and multiplying by the dilution factor. Accepted quality criteria include R² greater than 0.999, back-calculated standard concentrations within 5 percent of nominal values, and absorbance readings of unknown samples falling within the calibrated range; samples exceeding the upper limit must be diluted and reanalyzed. Instrument wavelength accuracy should be verified periodically, and reagent blank absorbance should remain low and consistent to protect detection sensitivity.
Interference Management
Matrix components such as proteins, nucleic acids, humic acids, and residual monosaccharides can bias results. Mitigation strategies include TCA deproteinization, dialysis or ultrafiltration for desalting and small-molecule removal, ethanol precipitation of the polysaccharide fraction before redissolution, and matrix-matched calibration using standard additions when interference cannot be fully eliminated. For EPS containing uronic acids or amino sugars, response factors differ from neutral hexoses, and method-specific correction factors or homologous standards should be applied.
Applications
The EPS standard curve determination supports diverse research and industrial applications:
- Fermentation process optimization, where EPS yield trajectories guide carbon source feeding, aeration, and harvest timing strategies
- Probiotic and starter culture characterization, comparing EPS production capacity among bacterial strains for texture-enhancing dairy applications
- Natural thickener and stabilizer development, including xanthan gum, gellan gum, pullulan, and bacterial cellulose production monitoring
- Activated sludge engineering, quantifying EPS fractions to understand flocculation, dewatering performance, and membrane fouling propensity
- Biofilm research, correlating matrix polysaccharide content with antimicrobial resistance and detachment behavior
- Pharmaceutical and cosmeceutical development, standardizing bioactive polysaccharides with immunomodulatory or moisturizing properties
- Microalgal biotechnology, tracking EPS secretion under nutrient stress conditions for bioremediation and biopolymer co-production
- Academic research and regulatory submissions, where validated calibration data substantiate quantitative claims in publications and product dossiers
FAQ
Why is glucose commonly used as the standard for EPS quantification?
Glucose is used because it is inexpensive, highly pure, stable, and readily available in analytical grade. Most EPS molecules are rich in hexose residues that respond to the phenol-sulfuric acid reagent with sensitivity similar to glucose. However, when EPS contains substantial fractions of uronic acids, pentoses, or amino sugars, using purified EPS from the target organism as the standard improves accuracy because response factors differ among monosaccharide types.
What concentration range should the standard curve cover?
A typical working range extends from 0 to 100 micrograms per milliliter for the phenol-sulfuric acid method in a 1 mL assay volume, providing absorbance values between 0 and approximately 1.0. The range must bracket all expected sample concentrations; any sample reading above the highest standard requires dilution, while readings near zero should be concentrated or assayed at larger volumes.
How often should the standard curve be renewed?
Best practice requires constructing a fresh standard curve with every analytical batch to compensate for reagent aging, instrument drift, and environmental variables. At minimum, a calibration verification standard should accompany each batch, and a full curve should be rebuilt whenever the verification standard deviates by more than 5 percent from its assigned value or when new reagent lots are introduced.
What R² value is acceptable for the calibration curve?
For research-grade quantification, R² should be 0.999 or higher, indicating that the linear model explains more than 99.9 percent of the variance. For routine quality control applications, R² of at least 0.99 is generally acceptable, provided individual standards back-calculate within 5 percent of nominal concentrations.
Can the phenol-sulfuric acid method distinguish EPS from residual sugars in the sample?
No, the method measures total water-soluble carbohydrates non-selectively. To isolate the EPS fraction, samples should undergo centrifugation to remove cells, followed by ethanol precipitation (typically 3 volumes of cold ethanol), dialysis against distilled water, and redissolution before assay. This pretreatment removes monosaccharides, oligosaccharides, and other low-molecular-weight carbohydrates that would otherwise inflate the result.
What safety precautions apply to these procedures?
Concentrated sulfuric acid is highly corrosive and the dehydration reaction is strongly exothermic. Work must be performed in a fume hood with heat-resistant gloves, lab coat, and eye protection. Tubes should be pointed away from personnel during acid addition, and phenol, which is toxic and readily absorbed through skin, requires dedicated handling protocols and appropriate waste disposal in accordance with institutional safety regulations.