Polymerization shrinkage is a critical quality parameter in polycarbonate (PC) synthesis and processing, directly affecting dimensional accuracy, optical clarity, and long-term part performance. This article provides a systematic analysis of the key factors influencing PC polymerization shrinkage, including monomer conversion, thermal conditions, catalyst systems, and formulation variables. It also outlines the standard samples, testing items, and measurement methods used to evaluate shrinkage behavior in laboratory and production environments.
Technical Overview
Polycarbonate (PC) is a high-performance engineering thermoplastic widely applied in optical lenses, automotive glazing, electronic housings, and medical devices due to its excellent transparency, impact resistance, and dimensional stability. During the synthesis and solidification of PC, the transformation from low-molecular-weight reactants, such as bisphenol A and diphenyl carbonate or phosgene-based intermediates, into a high-molecular-weight polymer network is accompanied by a measurable reduction in specific volume. This phenomenon, known as polymerization shrinkage, can lead to internal voids, residual stress, warpage, optical distortion, and dimensional deviation in finished products.
Understanding and controlling polymerization shrinkage requires a comprehensive analysis of material, process, and environmental variables. The shrinkage mechanism originates from the replacement of larger intermolecular van der Waals distances by shorter covalent bonds, combined with the removal of low-molecular-weight byproducts such as phenol during melt transesterification. Quantifying these effects through systematic testing enables manufacturers to optimize formulations, adjust processing windows, and ensure compliance with tight dimensional tolerances.
Primary Influencing Factors
- Degree of conversion: Incomplete polymerization leaves residual monomer and oligomers, resulting in non-uniform densification and variable shrinkage across the part.
- Monomer structure and feedstock purity: The molecular geometry of bisphenol A derivatives and the presence of impurities affect packing density and reaction kinetics.
- Polymerization temperature: Elevated temperatures accelerate chain growth and byproduct removal but also increase thermal contraction upon cooling.
- Pressure and vacuum conditions: Efficient vacuum removal of phenol and other volatiles during polycondensation promotes complete reaction and consistent volumetric contraction.
- Catalyst type and concentration: Catalyst residues influence reaction rate, molecular weight build-up, and the uniformity of shrinkage distribution.
- Molecular weight distribution: Higher average molecular weight generally corresponds to greater volumetric contraction during the polymerization stage.
- Fillers and reinforcement: Glass fiber, mineral fillers, and impact modifiers dilute the polymer phase and significantly reduce overall shrinkage.
- Cooling rate and mold conditions: Rapid cooling in injection molding induces frozen-in orientation and anisotropic shrinkage differences between flow and transverse directions.
Testing Samples
Raw Materials and Prepolymers
Representative samples include bisphenol A monomer, diphenyl carbonate, prepolymer flakes, and catalyst masterbatches. These samples are used to evaluate reactivity, purity, and their expected contribution to overall volumetric contraction.
PC Resins and Compounds
Virgin PC pellets, glass-fiber-reinforced PC compounds, PC/ABS blends, flame-retardant grades, and optical-grade resins are tested to compare shrinkage behavior across different formulations and filler loadings.
Molded and Finished Parts
Injection-molded plaques, standard test bars, lenses, and production components are analyzed to determine actual mold shrinkage, post-mold shrinkage, and dimensional stability under service conditions.
Testing Items
- Volumetric polymerization shrinkage percentage
- Linear (mold) shrinkage in flow and transverse directions
- Anisotropic shrinkage ratio
- Post-mold shrinkage after thermal conditioning
- Density and specific volume before and after polymerization
- Degree of conversion and residual monomer content
- Weight-average and number-average molecular weight
- Melt flow rate and viscosity changes
- Glass transition temperature and crystallization behavior
- Residual stress and dimensional stability assessment
Testing Methods
Dimensional Measurement Methods
Mold shrinkage is determined by comparing the dimensions of molded specimens with the corresponding mold cavity dimensions, following ASTM D955 and ISO 294-4. High-precision optical comparators, coordinate measuring machines, and laser scanners are employed to capture linear shrinkage with an accuracy of up to 0.01 mm.
Density-Based Volumetric Methods
Volumetric shrinkage is calculated from density measurements performed according to ASTM D792 and ISO 1183 using hydrostatic weighing or gas pycnometry. For reactive precursors, bonded-disk dilatometry and the Archimedes method provide direct volumetric contraction data, referenced against ISO 3521 for resin systems.
Thermal and Rheological Analysis
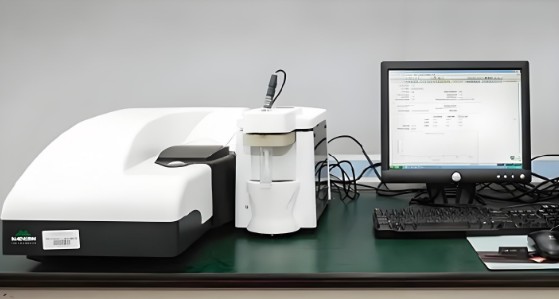
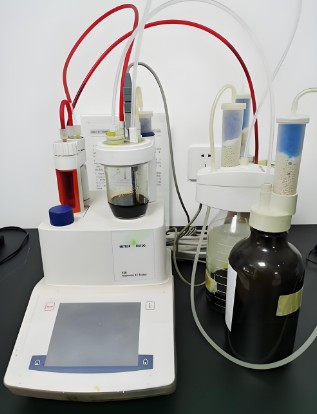
Differential scanning calorimetry (DSC) is applied to quantify the degree of conversion and residual reaction enthalpy, while thermogravimetric analysis (TGA) detects volatile byproducts and residual phenol. Gel permeation chromatography (GPC) establishes the relationship between molecular weight development and shrinkage magnitude. Melt flow rate testing per ASTM D1238 supplements these data by correlating viscosity evolution with densification behavior.
Applicable Standards
- ASTM D955 - Standard Test Method for Mold Shrinkage of Thermoplastics
- ISO 294-4 - Determination of Molding Shrinkage of Injection-Molded Test Specimens
- ASTM D2566 - Linear Shrinkage of Cured Thermosetting Resins
- ISO 3521 - Volumetric Shrinkage of Casting Resins
- ASTM D792 / ISO 1183 - Density of Plastics
- ASTM D1238 - Melt Flow Rate of Thermoplastics
Applications
Shrinkage analysis of PC materials supports quality control and product development across multiple high-value industries. Typical application scenarios include:
- Optical components: Precision lenses, ophthalmic eyewear, and light guides where optical distortion from non-uniform shrinkage must be minimized.
- Automotive engineering: Headlamp lenses, panoramic roof panels, and interior trim requiring predictable dimensional tolerances over wide temperature ranges.
- Electronics and telecommunications: Housing components, connector frames, and display panels demanding low warpage and stable assembly fit.
- Medical devices: Transparent surgical instruments, dialysis cartridges, and sterilizable housings requiring biocompatible, dimensionally stable materials.
- Material development: Formulation optimization for filled, blended, and copolymerized PC grades with tailored shrinkage characteristics.
FAQ
What is the typical shrinkage rate of polycarbonate?
Unfilled PC generally exhibits mold shrinkage in the range of 0.5 to 0.8 percent. Glass-fiber-reinforced grades show significantly reduced values, typically between 0.2 and 0.4 percent, due to the restricting effect of the filler on polymer contraction.
How does polymerization shrinkage differ from mold shrinkage?
Polymerization shrinkage refers to the volumetric contraction occurring during the chemical conversion of monomer or prepolymer into polymer, driven by bond shortening and byproduct removal. Mold shrinkage is the total dimensional reduction observed between the mold cavity and the cooled part, which combines polymerization effects, thermal contraction, and relaxation of processing-induced orientation.
Why does higher molecular weight increase volumetric shrinkage?
As chain length increases, more covalent bonds replace weaker intermolecular interactions, and free volume within the material decreases. This densification process produces greater volumetric contraction, which is why molecular weight control is essential for shrinkage consistency.
How can PC shrinkage be reduced in practice?
Effective strategies include optimizing catalyst concentration and vacuum conditions to ensure uniform conversion, incorporating glass fiber or mineral fillers, raising mold temperatures to reduce orientation, extending holding pressure and packing time, and annealing parts to relieve residual stress and stabilize final dimensions.
What testing turnaround and sample requirements are typical?
Standard dimensional and density-based shrinkage evaluations typically require molded plaques or test bars produced under documented processing conditions. Full analytical packages combining DSC, GPC, and rheological testing generally require several working days, depending on sample complexity and the number of conditions under investigation.